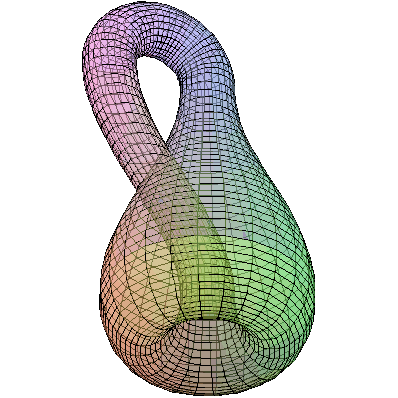
3D
PLOTTING EXAMPLES
by
Christopher
P. Benton, Ph.D.
The following
examples illustrate how to use many of the basic 3d plotting features
of MAPLE.
|
> |

|
Warning, the name changecoords
has been redefined


Here are
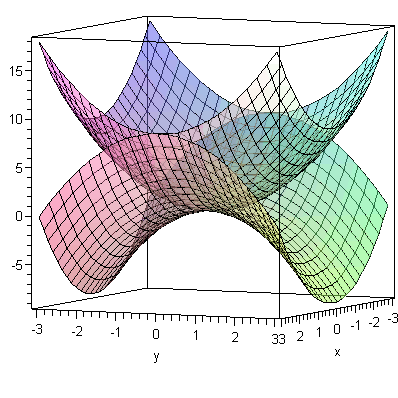
a couple of examples of basic 3d plots and how to combine them
into a single graph.
|
> |
![plot3d(x^2+y^2, x = -3 .. 3, y = -3 .. 3, transparency = .5, orientation = [25, 85], axes = boxed); 1](3dplottingexamples/3dPlottingExamples_11.gif)
![plot3d(x^2+y^2, x = -3 .. 3, y = -3 .. 3, transparency = .5, orientation = [25, 85], axes = boxed); 1](3dplottingexamples/3dPlottingExamples_12.gif) |
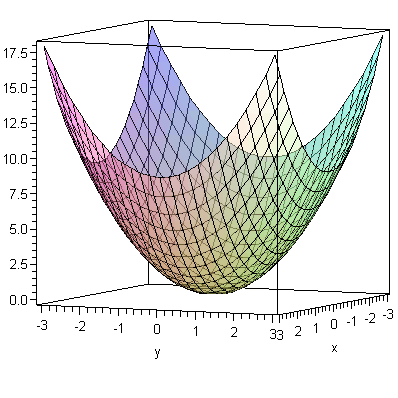
|
> |
![plot3d(x^2-y^2, x = -3 .. 3, y = -3 .. 3, transparency = .5, orientation = [25, 85], axes = boxed); 1](3dplottingexamples/3dPlottingExamples_14.gif)
![plot3d(x^2-y^2, x = -3 .. 3, y = -3 .. 3, transparency = .5, orientation = [25, 85], axes = boxed); 1](3dplottingexamples/3dPlottingExamples_15.gif) |
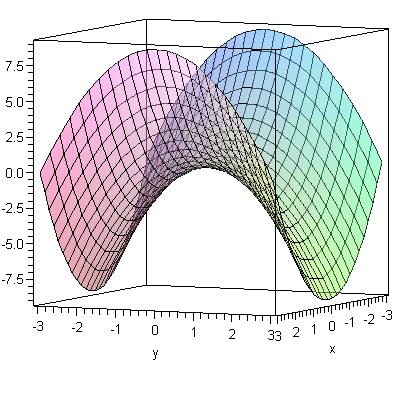
|
> |
![a1 := plot3d(x^2+y^2, x = -3 .. 3, y = -3 .. 3, transparency = .5, orientation = [25, 85], axes = boxed); -1](3dplottingexamples/3dPlottingExamples_17.gif)
![a1 := plot3d(x^2+y^2, x = -3 .. 3, y = -3 .. 3, transparency = .5, orientation = [25, 85], axes = boxed); -1](3dplottingexamples/3dPlottingExamples_18.gif) |
|
> |
![b1 := plot3d(x^2-y^2, x = -3 .. 3, y = -3 .. 3, transparency = .5, orientation = [25, 85], axes = boxed); -1](3dplottingexamples/3dPlottingExamples_19.gif)
![b1 := plot3d(x^2-y^2, x = -3 .. 3, y = -3 .. 3, transparency = .5, orientation = [25, 85], axes = boxed); -1](3dplottingexamples/3dPlottingExamples_20.gif) |
|
> |
![display([a1, b1]); 1](3dplottingexamples/3dPlottingExamples_21.gif)
|
|
> |
![plot3d(2*x+y+5, x = -3 .. 3, y = -3 .. 3, axes = normal, orientation = [65, 45], numpoints = 50); 1](3dplottingexamples/3dPlottingExamples_23.gif)
![plot3d(2*x+y+5, x = -3 .. 3, y = -3 .. 3, axes = normal, orientation = [65, 45], numpoints = 50); 1](3dplottingexamples/3dPlottingExamples_24.gif) |
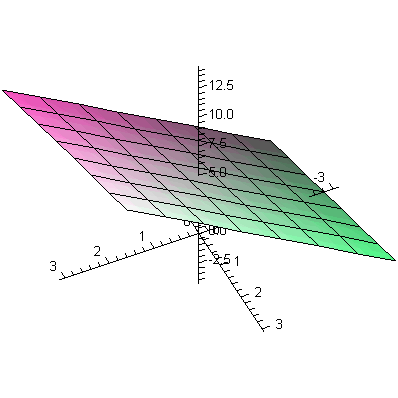
Here are
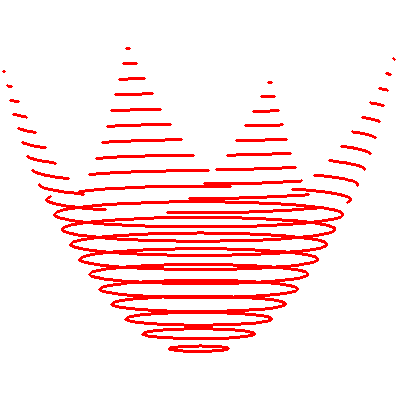
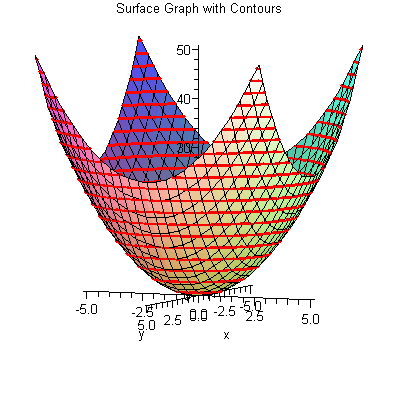
some examples of how you can create level curves in a plane and
contour lines on the graph itself.
|
> |

|
![(Typesetting:-mprintslash)([f := x^2+y^2], [x^2+y^2])](3dplottingexamples/3dPlottingExamples_27.gif)
|
> |
![plot3d(f, x = -5 .. 5, y = -5 .. 5, axes = normal, orientation = [25, 85]); 1](3dplottingexamples/3dPlottingExamples_28.gif)
|
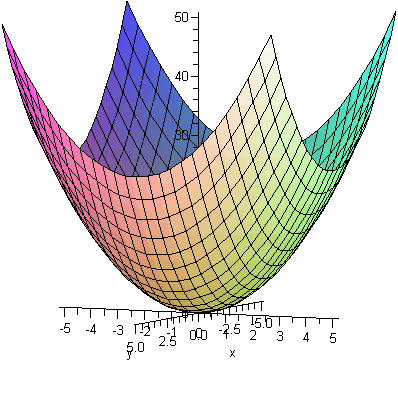
|
> |

|
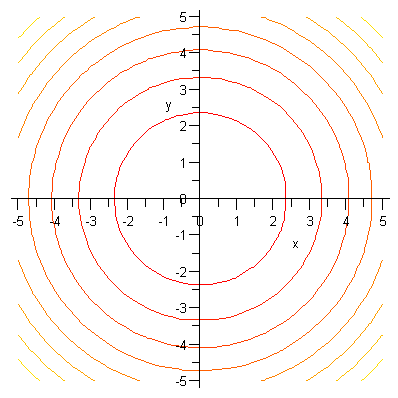
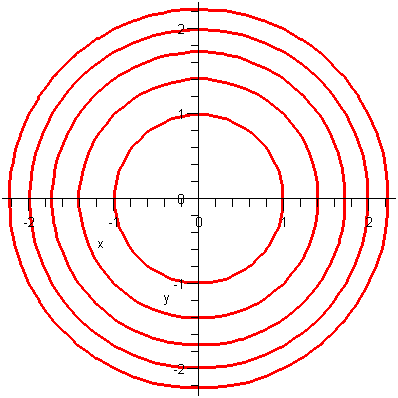
|
> |
![contourplot3d(f, x = -5 .. 5, y = -5 .. 5, contours = 20, thickness = 2, color = red, numpoints = 2000, orientation = [25, 85]); 1](3dplottingexamples/3dPlottingExamples_36.gif)
![contourplot3d(f, x = -5 .. 5, y = -5 .. 5, contours = 20, thickness = 2, color = red, numpoints = 2000, orientation = [25, 85]); 1](3dplottingexamples/3dPlottingExamples_37.gif) |
|
> |
![a2 := plot3d(f, x = -5 .. 5, y = -5 .. 5, axes = normal, orientation = [25, 85]); -1](3dplottingexamples/3dPlottingExamples_39.gif)
|
|
> |
![b2 := contourplot3d(f, x = -5 .. 5, y = -5 .. 5, contours = 20, thickness = 2, color = red, numpoints = 2000, orientation = [25, 85]); -1](3dplottingexamples/3dPlottingExamples_40.gif)
![b2 := contourplot3d(f, x = -5 .. 5, y = -5 .. 5, contours = 20, thickness = 2, color = red, numpoints = 2000, orientation = [25, 85]); -1](3dplottingexamples/3dPlottingExamples_41.gif) |
|
> |
![display([a2, b2], title =](3dplottingexamples/3dPlottingExamples_42.gif)
|
Here are
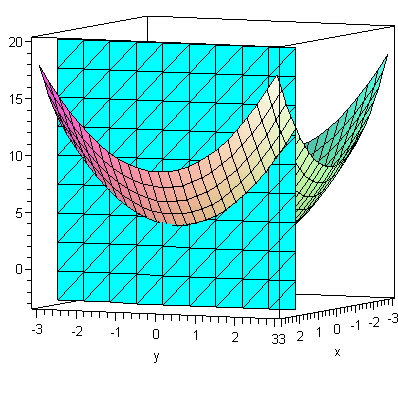
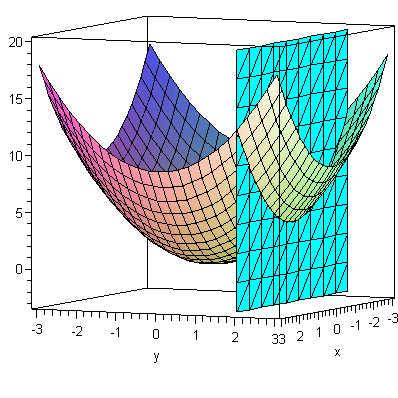
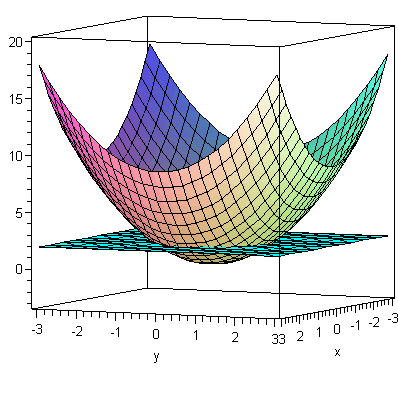
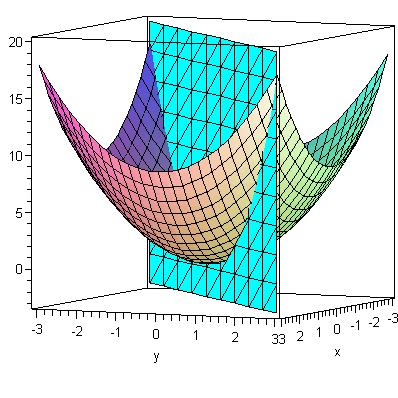
some examples of how to use implicitplot3d to examine the cross-sections
of a surface with a plane.
|
> |
![a3 := plot3d(x^2+y^2, x = -3 .. 3, y = -3 .. 3, orientation = [25, 85], axes = boxed); -1](3dplottingexamples/3dPlottingExamples_44.gif)
|
|
> |

|
|
> |
![display([a3, b3]); 1](3dplottingexamples/3dPlottingExamples_46.gif)
|
|
> |

|
|
> |
![display([a3, c3]); 1](3dplottingexamples/3dPlottingExamples_49.gif)
|
|
> |

|
|
> |
![display([a3, d3]); 1](3dplottingexamples/3dPlottingExamples_52.gif)
|
|
> |

|
|
> |
![display([a3, e3]); 1](3dplottingexamples/3dPlottingExamples_55.gif)
|
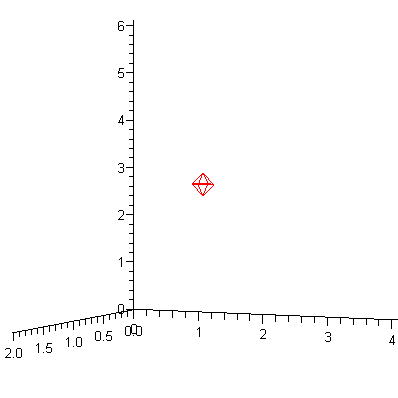
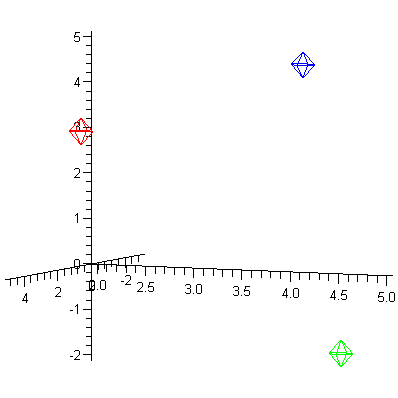
This is
how you can plot a single point or a series of points.
|
> |
![pointplot3d([1, 2, 3], axes = normal, symbol = circle, symbolsize = 40, color = red, orientation = [25, 85]); 1](3dplottingexamples/3dPlottingExamples_57.gif)
![pointplot3d([1, 2, 3], axes = normal, symbol = circle, symbolsize = 40, color = red, orientation = [25, 85]); 1](3dplottingexamples/3dPlottingExamples_58.gif) |
|
> |
![pointplot3d([[1, 2, 3], [-3, 4, -2], [5, 5, 5]], axes = normal, symbol = circle, symbolsize = 40, color = [red, green, blue], orientation = [25, 85]); 1](3dplottingexamples/3dPlottingExamples_60.gif)
![pointplot3d([[1, 2, 3], [-3, 4, -2], [5, 5, 5]], axes = normal, symbol = circle, symbolsize = 40, color = [red, green, blue], orientation = [25, 85]); 1](3dplottingexamples/3dPlottingExamples_61.gif) |
Here are
some curves in space that ae defined by a single parameter.
|
> |
![spacecurve([cos(t), sin(t), 0], t = 0 .. 2*Pi, thickness = 3, color = red, axes = normal); 1](3dplottingexamples/3dPlottingExamples_63.gif)
![spacecurve([cos(t), sin(t), 0], t = 0 .. 2*Pi, thickness = 3, color = red, axes = normal); 1](3dplottingexamples/3dPlottingExamples_64.gif) |
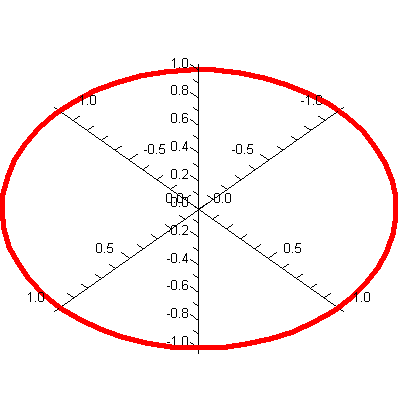
|
> |
![spacecurve([cos(t), sin(t), t], t = 0 .. 16*Pi, thickness = 3, color = red, axes = normal, numpoints = 1000); 1](3dplottingexamples/3dPlottingExamples_66.gif)
![spacecurve([cos(t), sin(t), t], t = 0 .. 16*Pi, thickness = 3, color = red, axes = normal, numpoints = 1000); 1](3dplottingexamples/3dPlottingExamples_67.gif) |
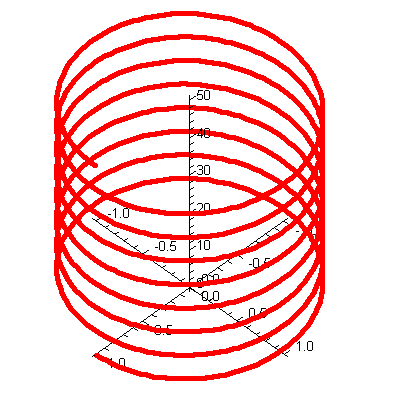
|
> |
![spacecurve([cos(t), sin(t), .5*cos(10*t)], t = 0 .. 16*Pi, thickness = 3, color = red, axes = normal, numpoints = 1000, scaling = constrained); 1](3dplottingexamples/3dPlottingExamples_69.gif)
![spacecurve([cos(t), sin(t), .5*cos(10*t)], t = 0 .. 16*Pi, thickness = 3, color = red, axes = normal, numpoints = 1000, scaling = constrained); 1](3dplottingexamples/3dPlottingExamples_70.gif) |
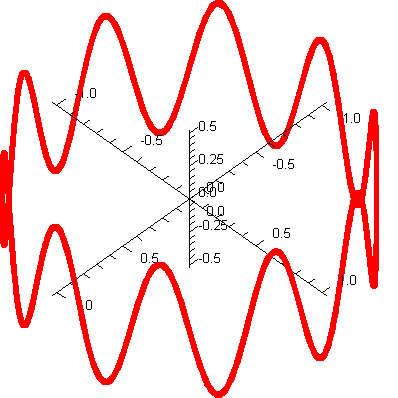
|
> |
![spacecurve([cos(t), sin(t), .5*cos(10*t)*t], t = 0 .. 16*Pi, thickness = 1, color = red, axes = normal, numpoints = 2000); 1](3dplottingexamples/3dPlottingExamples_72.gif)
![spacecurve([cos(t), sin(t), .5*cos(10*t)*t], t = 0 .. 16*Pi, thickness = 1, color = red, axes = normal, numpoints = 2000); 1](3dplottingexamples/3dPlottingExamples_73.gif) |
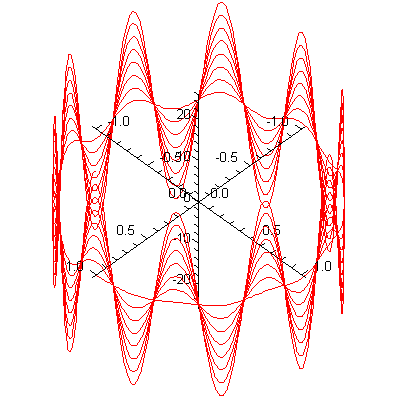
|
> |
![a4 := plot3d(x^2-y^2, x = -3 .. 3, y = -3 .. 3, axes = normal, transparency = .5, orientation = [65, 85]); -1](3dplottingexamples/3dPlottingExamples_75.gif)
![a4 := plot3d(x^2-y^2, x = -3 .. 3, y = -3 .. 3, axes = normal, transparency = .5, orientation = [65, 85]); -1](3dplottingexamples/3dPlottingExamples_76.gif) |
|
> |
![b4 := spacecurve([t, 2, t^2-4], t = -3 .. 3, color = red, thickness = 3); -1](3dplottingexamples/3dPlottingExamples_77.gif)
|
|
> |
![display([a4, b4]); 1](3dplottingexamples/3dPlottingExamples_78.gif)
|
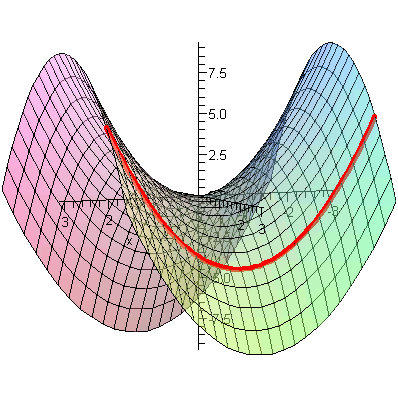
|
> |
![a5 := pointplot3d([[0, 0, 0], [3, 4, 6]], axes = normal, symbol = circle, symbolsize = 40, color = [green, blue], orientation = [25, 85]); -1](3dplottingexamples/3dPlottingExamples_80.gif)
![a5 := pointplot3d([[0, 0, 0], [3, 4, 6]], axes = normal, symbol = circle, symbolsize = 40, color = [green, blue], orientation = [25, 85]); -1](3dplottingexamples/3dPlottingExamples_81.gif) |
|
> |
![b5 := spacecurve([3*t, 4*t, 6*t], t = 0 .. 1, color = red, thickness = 3, axes = normal, orientation = [25, 85]); -1](3dplottingexamples/3dPlottingExamples_82.gif)
![b5 := spacecurve([3*t, 4*t, 6*t], t = 0 .. 1, color = red, thickness = 3, axes = normal, orientation = [25, 85]); -1](3dplottingexamples/3dPlottingExamples_83.gif) |
|
> |
![display([a5, b5]); 1](3dplottingexamples/3dPlottingExamples_84.gif)
|
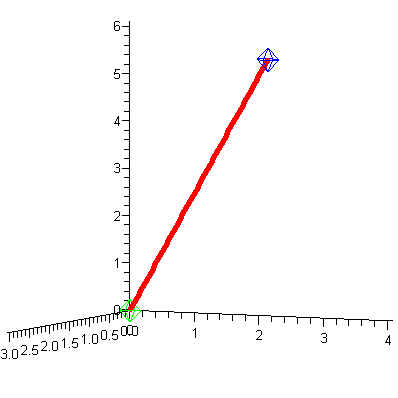
|
> |
![a6 := pointplot3d([[3, 2, 5], [8, 4, 8], [0, 0, 0]], axes = normal, symbol = circle, symbolsize = 40, color = [green, blue, brown], orientation = [25, 85]); -1](3dplottingexamples/3dPlottingExamples_86.gif)
![a6 := pointplot3d([[3, 2, 5], [8, 4, 8], [0, 0, 0]], axes = normal, symbol = circle, symbolsize = 40, color = [green, blue, brown], orientation = [25, 85]); -1](3dplottingexamples/3dPlottingExamples_87.gif) |
|
> |
![display([a6, b6]); 1](3dplottingexamples/3dPlottingExamples_91.gif)
|
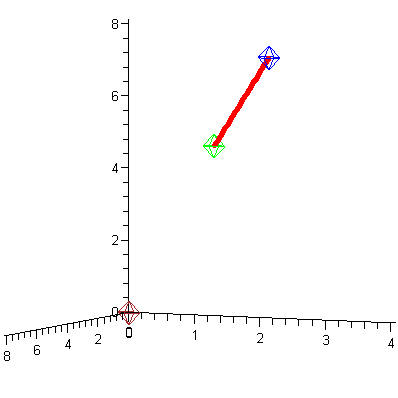
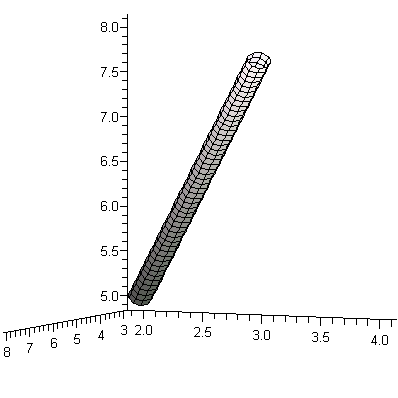
Here are
a couple of tubeplots.
|
> |
![tubeplot([cos(t), sin(t), t], t = 0 .. 16*Pi, numpoints = 1000, axes = normal, radius = 0.8e-1, orientation = [25, 55]); 1](3dplottingexamples/3dPlottingExamples_93.gif)
![tubeplot([cos(t), sin(t), t], t = 0 .. 16*Pi, numpoints = 1000, axes = normal, radius = 0.8e-1, orientation = [25, 55]); 1](3dplottingexamples/3dPlottingExamples_94.gif) |
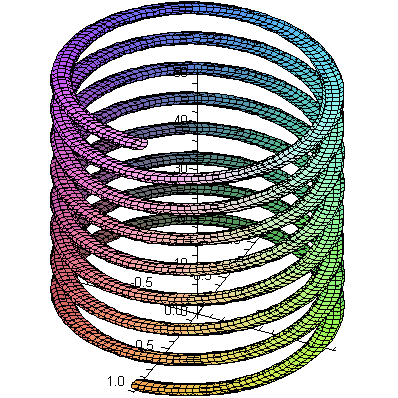
|
> |
![tubeplot([3+5*t, 2+2*t, 5+3*t], t = 0 .. 1, radius = .1, axes = normal, orientation = [25, 85])](3dplottingexamples/3dPlottingExamples_96.gif)
![tubeplot([3+5*t, 2+2*t, 5+3*t], t = 0 .. 1, radius = .1, axes = normal, orientation = [25, 85])](3dplottingexamples/3dPlottingExamples_97.gif) |
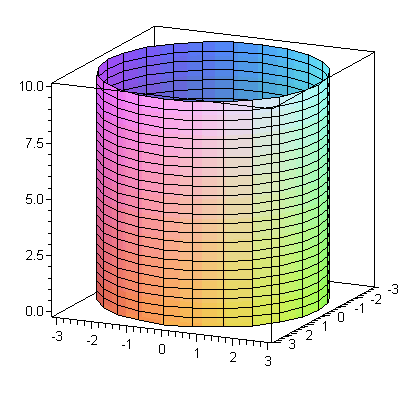
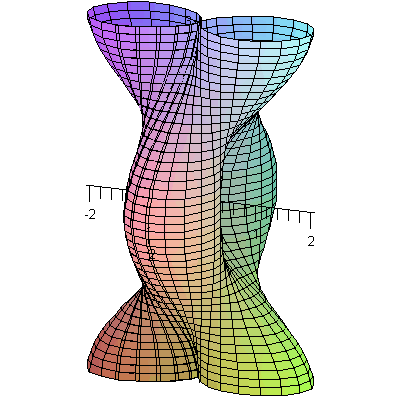
Here are
a couple examples of plots using cylindrical coordinates.
|
> |
![plot3d(3, theta = 0 .. 2*Pi, z = 0 .. 10, coords = cylindrical, axes = boxed, orientation = [25, 75]); 1](3dplottingexamples/3dPlottingExamples_99.gif)
![plot3d(3, theta = 0 .. 2*Pi, z = 0 .. 10, coords = cylindrical, axes = boxed, orientation = [25, 75]); 1](3dplottingexamples/3dPlottingExamples_100.gif) |
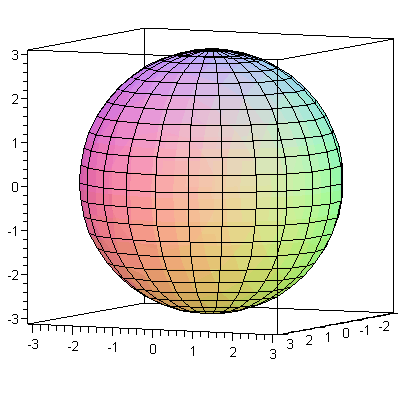
Here are
a couple of examples of plots using spherical coordinates.
|
> |
![plot3d(3, theta = 0 .. 2*Pi, phi = 0 .. Pi, coords = spherical, axes = boxed, orientation = [25, 85]); 1](3dplottingexamples/3dPlottingExamples_106.gif)
![plot3d(3, theta = 0 .. 2*Pi, phi = 0 .. Pi, coords = spherical, axes = boxed, orientation = [25, 85]); 1](3dplottingexamples/3dPlottingExamples_107.gif) |
|
> |
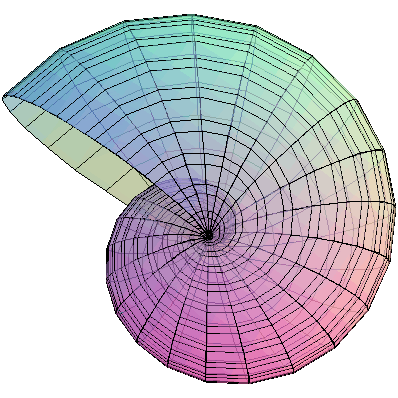
![plot3d(sin(phi)*.8^theta, theta = 0 .. 3*Pi, phi = 0 .. Pi, color = phi, scaling = constrained, coords = spherical, orientation = [-45, 45], numpoints = 1000); 1](3dplottingexamples/3dPlottingExamples_109.gif)
![plot3d(sin(phi)*.8^theta, theta = 0 .. 3*Pi, phi = 0 .. Pi, color = phi, scaling = constrained, coords = spherical, orientation = [-45, 45], numpoints = 1000); 1](3dplottingexamples/3dPlottingExamples_110.gif) |
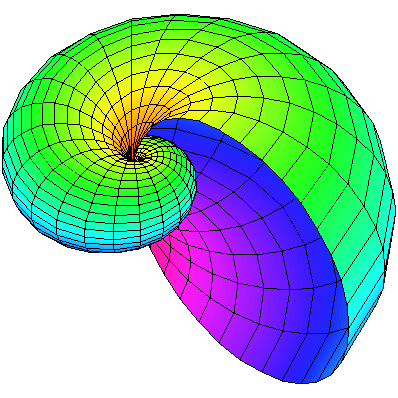
|
> |
![plot3d(sin(phi)*1.3^theta, theta = 0 .. 3*Pi, phi = 0 .. Pi, color = phi, scaling = constrained, coords = spherical, orientation = [-45, 45], numpoints = 1000); 1](3dplottingexamples/3dPlottingExamples_112.gif)
![plot3d(sin(phi)*1.3^theta, theta = 0 .. 3*Pi, phi = 0 .. Pi, color = phi, scaling = constrained, coords = spherical, orientation = [-45, 45], numpoints = 1000); 1](3dplottingexamples/3dPlottingExamples_113.gif) |
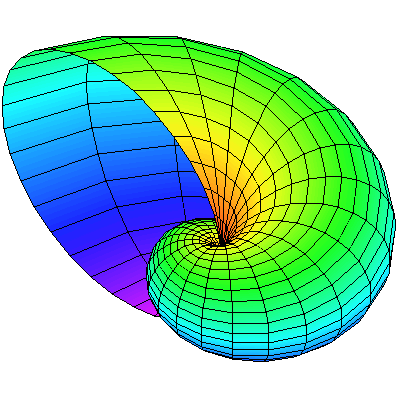
And finally,
here are some examples of surfaces that are defined parametrically
using two parameters.
|
> |
![plot3d([u*cos(v), u*sin(v), 10*u], u = 0 .. 1, v = 0 .. 2*Pi, axes = normal); 1](3dplottingexamples/3dPlottingExamples_115.gif)
|
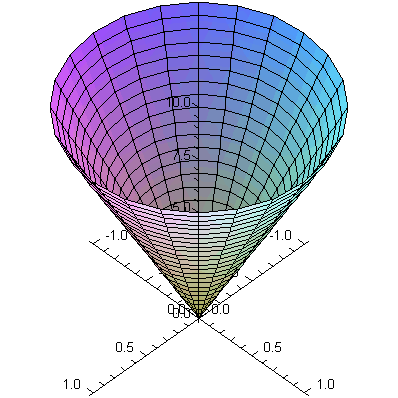
|
> |
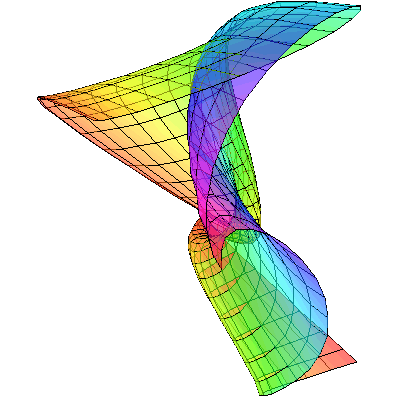
![plot3d([10+4*cos(u), v, 4*sin(u)], u = 0 .. 2*Pi, v = 0 .. 2*Pi, scaling = constrained, coords = cylindrical, transparency = .5); 1](3dplottingexamples/3dPlottingExamples_117.gif)
![plot3d([10+4*cos(u), v, 4*sin(u)], u = 0 .. 2*Pi, v = 0 .. 2*Pi, scaling = constrained, coords = cylindrical, transparency = .5); 1](3dplottingexamples/3dPlottingExamples_118.gif) |
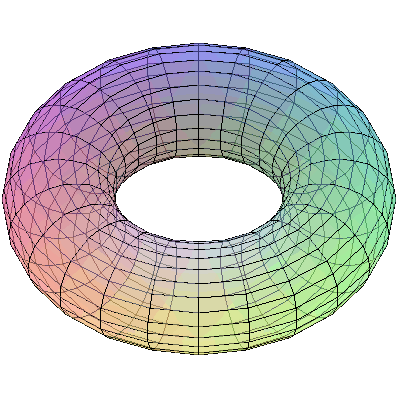
|
> |
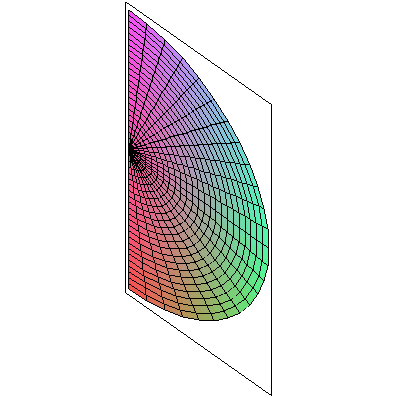
![plot3d([rho, 1/2*Pi, phi], rho = 0 .. 5, phi = 0 .. Pi, coords = spherical, axes = boxed, scaling = constrained); 1](3dplottingexamples/3dPlottingExamples_128.gif)
![plot3d([rho, 1/2*Pi, phi], rho = 0 .. 5, phi = 0 .. Pi, coords = spherical, axes = boxed, scaling = constrained); 1](3dplottingexamples/3dPlottingExamples_129.gif) |
|
> |
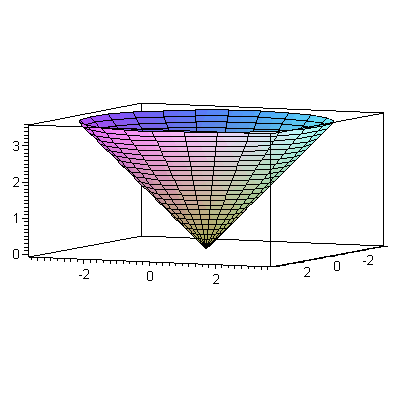
![plot3d([rho, theta, 1/4*Pi], rho = 0 .. 5, theta = 0 .. 2*Pi, coords = spherical, axes = boxed, scaling = constrained, orientation = [25, 85]); 1](3dplottingexamples/3dPlottingExamples_131.gif)
![plot3d([rho, theta, 1/4*Pi], rho = 0 .. 5, theta = 0 .. 2*Pi, coords = spherical, axes = boxed, scaling = constrained, orientation = [25, 85]); 1](3dplottingexamples/3dPlottingExamples_132.gif) |
|
> |
![plot3d([r, 1/4*Pi, z], r = 0 .. 5, z = 0 .. 5, coords = cylindrical, axes = boxed, scaling = constrained, orientation = [25, 85]); 1](3dplottingexamples/3dPlottingExamples_134.gif)
![plot3d([r, 1/4*Pi, z], r = 0 .. 5, z = 0 .. 5, coords = cylindrical, axes = boxed, scaling = constrained, orientation = [25, 85]); 1](3dplottingexamples/3dPlottingExamples_135.gif) |
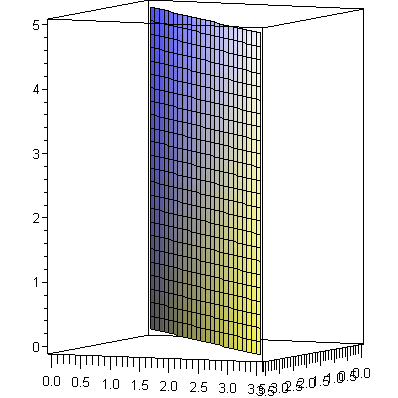
|
> |
![plot3d([r, theta, 5], r = 0 .. 5, theta = 0 .. 2*Pi, coords = cylindrical, axes = boxed, scaling = constrained, orientation = [25, 65]); 1](3dplottingexamples/3dPlottingExamples_137.gif)
![plot3d([r, theta, 5], r = 0 .. 5, theta = 0 .. 2*Pi, coords = cylindrical, axes = boxed, scaling = constrained, orientation = [25, 65]); 1](3dplottingexamples/3dPlottingExamples_138.gif) |
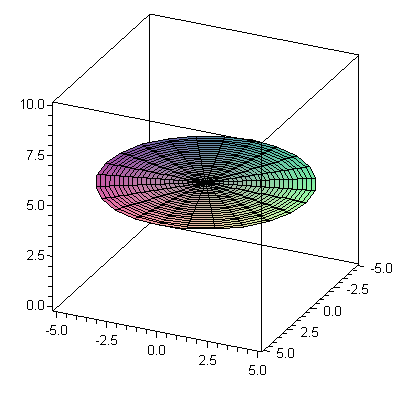
And finally,
here are a couple of nonorientable surfaces. The Mobius
strip is the classic example of a one-sided surface, and the Klein
bottle takes a twist through a fourth dimension in order to create
a 3-dimensional object whose inside is the same as its outside.
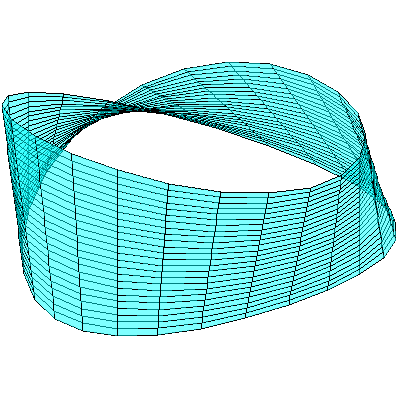
|
> |
![klein1 := plot3d([(2.5+1.5*cos(v))*cos(u), (2.5+1.5*cos(v))*sin(u), 3*v], u = 0 .. 2*Pi, v = 0 .. Pi, transparency = .5); -1](3dplottingexamples/3dPlottingExamples_144.gif)
![klein1 := plot3d([(2.5+1.5*cos(v))*cos(u), (2.5+1.5*cos(v))*sin(u), 3*v], u = 0 .. 2*Pi, v = 0 .. Pi, transparency = .5); -1](3dplottingexamples/3dPlottingExamples_145.gif) |
|
> |
![klein2 := plot3d([2-2*cos(v)+sin(u), cos(u), 3*v], u = 0 .. 2*Pi, v = 0 .. Pi, transparency = .5); -1](3dplottingexamples/3dPlottingExamples_146.gif)
![klein2 := plot3d([2-2*cos(v)+sin(u), cos(u), 3*v], u = 0 .. 2*Pi, v = 0 .. Pi, transparency = .5); -1](3dplottingexamples/3dPlottingExamples_147.gif) |
|
> |
![klein3 := plot3d([2+(2+cos(u))*cos(v), sin(u), 3*Pi+(2+cos(u))*sin(v)], u = 0 .. 2*Pi, v = 0 .. Pi, transparency = .5); -1](3dplottingexamples/3dPlottingExamples_148.gif)
![klein3 := plot3d([2+(2+cos(u))*cos(v), sin(u), 3*Pi+(2+cos(u))*sin(v)], u = 0 .. 2*Pi, v = 0 .. Pi, transparency = .5); -1](3dplottingexamples/3dPlottingExamples_149.gif) |
|
> |
![display([klein1, klein2, klein3, klein4], orientation = [65, 125], scaling = constrained); 1](3dplottingexamples/3dPlottingExamples_153.gif)
![display([klein1, klein2, klein3, klein4], orientation = [65, 125], scaling = constrained); 1](3dplottingexamples/3dPlottingExamples_154.gif) |
